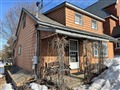
67 Sydenham St
$191,093
Comparative Market Analysis
Jul 1, 2025
NOT AN ACTIVE LISTING
Historical Performance
| Period | $ Change | % Change |
| 1 Day | +$13 | +0.007% |
| 7 Days | -$118 | -0.061% |
| 30 Days | -$683 | -0.356% |
| 3 Months | -$995 | -0.518% |
| 6 Months | +$2,868 | +1.52% |
| 1 Year | -$10.4k | -5.18% |
| 3 Years | +$28.6k | +17.6% |
| 5 Years | +$46.0k | +31.7% |
| 10 Years | +$95.4k | +99.7% |
List My Property
Real Estate Statistics
Financing Solutions
AS SEEN ON


Are You a Licensed Real Estate Agent or Broker?